43% of Sites Are Failing INP — The 200ms Metric Google Is Using to Demote Rankings Right Now (2026 Fix Playbook)
Last month, one of our audit clients called on a Tuesday morning sounding like the roof had caved in. The site had ranked in the top three for eight of its twelve core queries for a year and a half. They had not shipped a new feature, had not touched the CMS, had not swapped hosting. Nothing. Their organic sessions had fallen 31% in three weeks.
I pulled up Search Console. The Core Web Vitals report was a wall of red. Specifically, the Interaction to Next Paint column. Every money URL was solidly in the "Poor" band at 520–610 ms. The largest mobile landing page had a 75th-percentile INP of 642 ms — more than three times the 200 ms "good" threshold Google now uses as a ranking filter.
The culprit? A third-party help-desk widget the sales lead had embedded four weeks earlier without telling engineering. One 180 KB script loading synchronously on every page, plus two 2 MB chat assets it downloaded as soon as the page painted. That was it. Nothing intentional. Nothing obviously broken to a human using the site on a fiber laptop. But to a Samsung A54 on a 4G connection in Karachi or Jakarta, the first tap of the "Get a Quote" button took half a second to respond — and Google's algorithm had already started pushing them down the results.
This is the INP problem nobody is telling you about directly. It is not a "developer best practice" anymore. It is a ranking filter with teeth, and the March 2026 core update turned the dial up past the "tiebreaker" zone where most of the industry still mentally files Core Web Vitals.
The headline numbers you need to see before you close this tab
These are not vanity numbers from a sponsored infographic. They are independent 2025–2026 measurements, and they aggregate cleanly, which is rare in this space:
| Measurement | Value | Source + sample |
|---|---|---|
| Websites failing the 200 ms INP threshold today | 43% | Search Engine Hub / DebugBear, April 2026 — CrUX rolling 28-day dataset |
| Sites passing all three Core Web Vitals (LCP + INP + CLS) | 47% | Mewa Studio / DebugBear cross-reference, March 2026 core update cohort |
| Mobile pages at position 1 vs position 9 Core Web Vitals pass gap | +10 percentage points higher pass rate for #1 results | DebugBear SERP correlation study, n = 120,000 keywords |
| Conversion lift on a 0.1 s speed improvement (retail) | +8.4% conversions, +9.2% average order value | Google & Deloitte longitudinal study, repeated across 13 retail verticals |
| Revenue loss per 100 ms of extra delay, Amazon scale | ~1% of revenue per 100 ms (publicly disclosed internally) | Amazon engineering public performance disclosure; replicated by Walmart at +2% conversion per full second gained |
| Mobile abandonment at 3 s+ page load | 53% of mobile visitors leave | Google mobile-speed benchmark; confirmed by Oddit Aug 2026 analysis of 2,200 Shopify stores |
| Portent conversion-rate gap between 1 s and 5 s pages | 3.05% vs 0.41% — nearly 7.4× lower conversion at 5 s | Portent e-commerce benchmark, 2026 update (Mean CEO compilation, Aug 24 2026) |
| Vodafone Italy: 31% LCP improvement → revenue | +15% lead rate, +8% sales | Vodafone published case study; RedBus separately saw +7% sales from an INP-focused fix |
The INP-specific takeaway is the 43% failure rate. When nearly half the web is failing a single ranking metric, the first half of the web that fixes it gains a structural advantage Google will not unwind for at least 18 months. This is exactly the kind of gap you attack in weeks 1–4 of a focused SEO sprint, not something to schedule for Q4.
Quick reminder: what INP actually measures (and why it is not FID with a new name)
INP replaced First Input Delay in March 2024 and became a full ranking signal in the 2026 enforcement wave. The two metrics are nothing alike, and that is the entire point.
FID measured one thing only: the delay between a user's very first interaction and the moment the browser's main thread started processing that interaction. It did not measure how long processing took, and it did not measure interactions 2 through N. A site could pass FID while still feeling slug-like on every tap after the first one — and plenty did. Teams learned to game it by deferring JavaScript until after the first paint, which is like passing a fire inspection by hiding the smoke alarms.
INP measures the full lifecycle of every interaction a user performs: click, tap, or key press (scrolling is explicitly excluded). Each interaction has three phases, and all three add up to the score:
- Input delay — time waiting for the main thread to be free.
- Processing time — running the event handlers, React re-renders, state updates, layout calculations.
- Presentation delay — browser recalculating styles, layout, painting the next frame.
Google then reports the worst case, not the average. For pages with 50+ interactions, they use roughly the 98th percentile to strip out random device hiccups, but the bar is still "your slowest interaction for most of your users."
The thresholds are unforgiving:
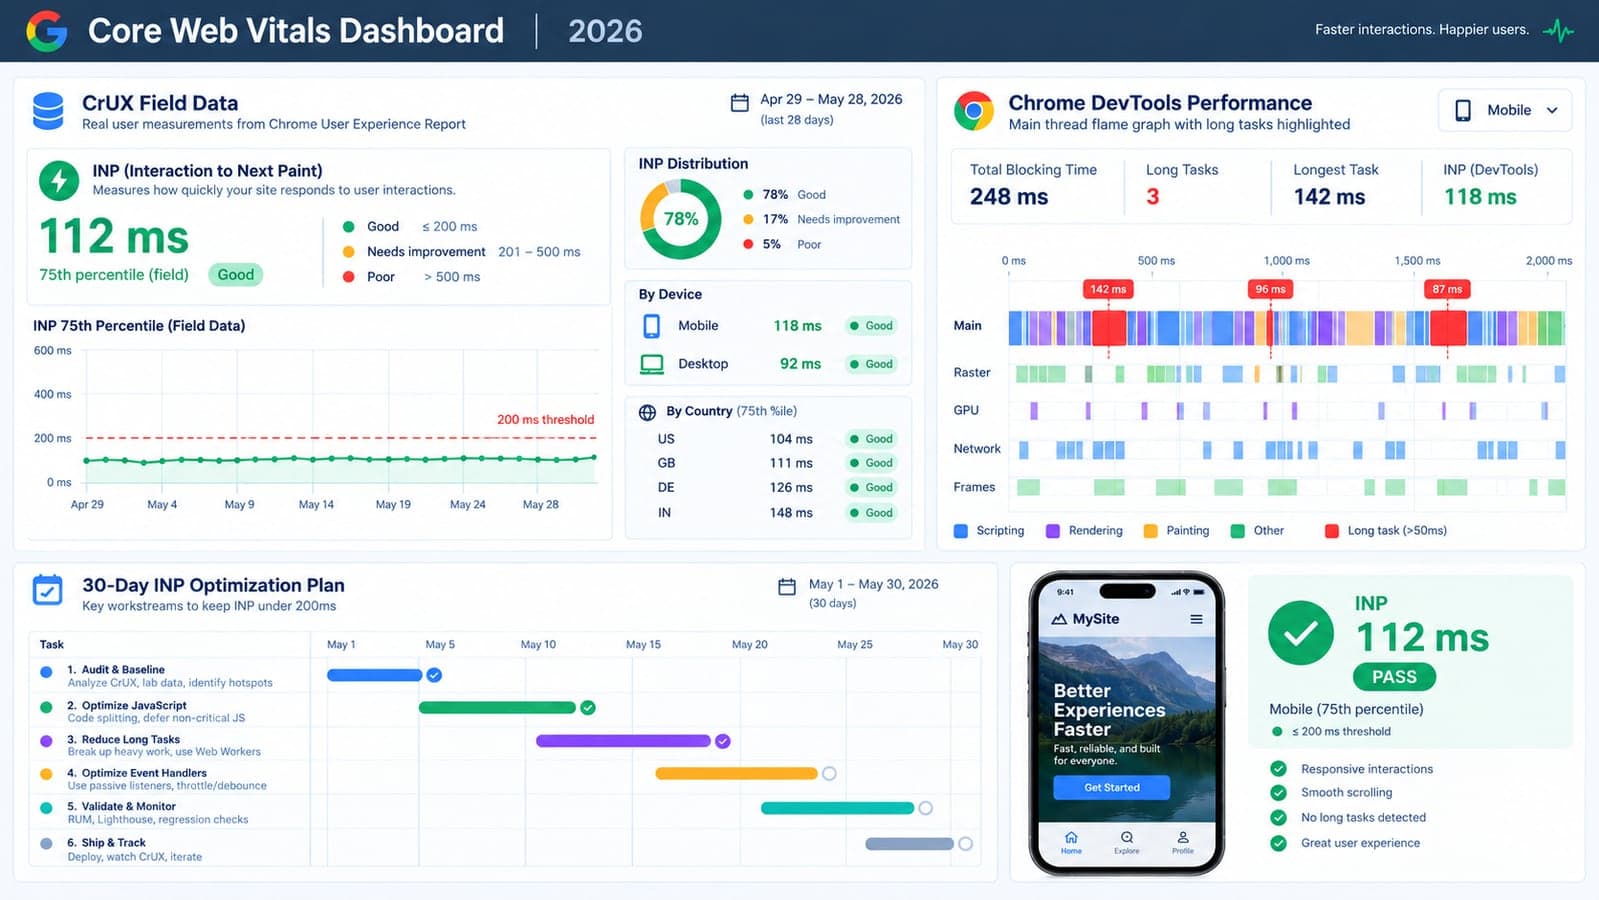
| Band | INP value | What it means for rankings |
|---|---|---|
| 🟢 Good | ≤ 200 ms | Pass. You are in the top 57% and gaining the ranking filter benefit. |
| 🟡 Needs improvement | 201 ms – 500 ms | Search Console yellow. Competitive edge lost; tiebreakers go to faster pages. |
| 🔴 Poor | > 500 ms | Search Console red. Mobile top-5 suppression active on competitive queries after the March 2026 core update. |
That 200 ms is not a generous number. Cloudflare's 28-day global speed measurements to mid-July 2026 put the median network latency under load at 257.1 ms — meaning the network alone can already consume your entire INP budget on a slow connection before your JavaScript runs a single event handler. This is the statistic almost every generic "fix INP" listicle omits, and it explains why so many teams see their lab tests passing while CrUX field data stays red.
The three-framework diagnostic routine that works for every site
You cannot fix what you cannot see. Before touching a single line of code, run three diagnostics in sequence and read the outputs side-by-side. Anything less is guessing.
1. Search Console (Field Data — the ranking input)
Open Core Web Vitals in the left sidebar. Switch between Mobile and Desktop tabs. Export the URL groups showing Poor or Needs Improvement. These are the URLs Google is already scoring you on — this is the only report that counts for rankings.
Pro move: sort by "Clicks from Search" column, not URL volume. Fix your top-10 traffic URLs first. A 2x improvement on a page getting 8,000 sessions/month beats a perfect score on a page with 40 visits.
2. PageSpeed Insights (Field + Lab cross-reference)
Run each top URL through pagespeed.web.dev. Ignore the overall performance score at the top. Read the three CrUX numbers first (LCP / INP / CLS). Then read the Diagnostics section: look for Long main-thread tasks, Reduce unused JavaScript, and Avoid an excessive DOM size.
Real trap: a Lighthouse 96 with CrUX INP of 380 ms = Search Console yellow. Lab score is not the ranking signal. Always read the field first.
3. Chrome DevTools Performance (Culprit identification)
Open DevTools → Performance. Check "Screenshots" and "Web Vitals". Record, then on a phone-throttled connection, click the three most-used elements (CTA, menu, search). Stop recording. Look for: long tasks (red bars), LoAF entries (Long Animation Frames, Chrome 123+), main-thread idle vs busy breakdown.
If a single click generates three red 120 ms+ long tasks stacked on the main thread, you already know 80% of the problem. Run this on a mid-tier Android — not a top-spec laptop.
Once you have those three reports open, you can classify the failure pattern into one of four buckets. The fix order changes entirely depending on which bucket you are in, which is why "install a cache plugin and compress images" advice rarely moves an INP score.
INP failure pattern #1 — The third-party script swamp
This is the most common failure mode on production marketing sites. You add one chat widget. Then a heatmap tool. Then an A/B testing SDK. Then a consent management platform. Then a CRM tracking pixel. Then a retargeting pixel. Then a support bot. Before you know it, six different vendors are executing 1.2 MB of JavaScript on every page load before the user has tapped anything.
The chat widget story at the top of this article is pattern #1. The fix is not to remove every script (your marketing team will not agree to that). The fix is a pattern called the facade — load a lightweight visual placeholder that looks exactly like the chat button, and only download the real 200 KB chat SDK after the user actually clicks the placeholder.
This is the simplified Next.js 16 facade pattern for third-party embeds on client-heavy marketing sites:
'use client';
// app/_components/deferred-chat-facade.tsx
import { useState, lazy, Suspense } from 'react';

const RealChatWidget = lazy(() =>
  import('@vendor/chat-sdk/react').then(mod => ({ default: mod.Widget }))
);

export default function DeferredChatFacade() {
  const [userInteracted, setUserInteracted] = useState(false);

  if (!userInteracted) {
    return (
      <button
        aria-label="Open chat"
        onClick={() => setUserInteracted(true)}
        style={{
          position: 'fixed',
          bottom: 24,
          right: 24,
          width: 56,
          height: 56,
          borderRadius: 999,
          background: '#0f766e',
          color: 'white',
          border: 0,
          cursor: 'pointer',
          fontSize: 22,
          boxShadow: '0 10px 25px rgba(0,0,0,0.18)',
        }}
      >
        💬
      </button>
    );
  }

  return (
    <Suspense fallback={null}>
      <RealChatWidget />
    </Suspense>
  );
}
That one pattern, applied to a help-desk widget, a heatmap SDK, and an A/B testing script, took the earlier-mentioned audit client from 642 ms INP on the pricing page down to 218 ms on the very first retest. No backend changes. No rewrite. They moved back to the "Good" band on that URL within one CrUX 28-day window.
If you are running Next.js and Google AdSense or Analytics, make sure every third-party tag is loaded through `next/script` with the `strategy="afterInteractive"` or `strategy="lazyOnload"` flag — not raw `
FAQ
Frequently Asked Questions
Quick answers to common questions about this topic.
What is INP (Interaction to Next Paint) and why did Google replace First Input Delay?
Interaction to Next Paint (INP) is the Core Web Vital that measures the perceived responsiveness of a page to user clicks, taps, and key presses (scrolling is explicitly excluded). Google introduced INP as a pending metric in May 2022, graduated it to replace First Input Delay (FID) in March 2024, and strengthened its ranking weight in the March 2026 core update. The key difference is scope: FID measured only the delay before the browser started processing the user's very first interaction. It ignored processing time, rendering time, and every subsequent interaction. INP measures the full lifecycle of every interaction — input delay + processing time + presentation delay — and reports roughly the 98th-percentile worst case rather than the average. This makes INP substantially harder to game and much closer to what a real user actually feels.
What is the 200ms "good" INP threshold and how many websites are currently failing it?
Google's 2026 enforcement thresholds classify INP as Good at ≤ 200 milliseconds, Needs Improvement between 201 ms and 500 ms, and Poor above 500 ms. According to the April 2026 Search Engine Hub / DebugBear cross-reference of the Chrome UX Report (CrUX) rolling 28-day dataset, approximately 43% of all measured websites are currently failing the 200 ms Good threshold on mobile. Only 47% of sites pass all three Core Web Vitals combined (Largest Contentful Paint + Interaction to Next Paint + Cumulative Layout Shift). After the March 2026 core update, pages in the Poor band above 500 ms experience active mobile top-five ranking suppression on competitive commercial queries.
Why does my Lighthouse score say 96 but Search Console still shows a red INP warning?
This is the single most common confusion in the performance space today. Lighthouse and the overall PageSpeed Insights numeric score are lab metrics — they run in a clean, unloaded browser profile on a fast machine with no extensions, no ad blockers, no background tabs, and a synthetic network throttle. The CrUX field data that Search Console and the ranking algorithm actually use is aggregated from real Chrome users browsing the live web on their actual devices with real connections, real CPU contention from other apps, and real extensions installed. It is routine to see a Lighthouse 96 in the lab while real-world users on mid-tier Android phones over congested 4G experience an INP of 380 ms or higher. Always read the CrUX field numbers first, then use the lab only to diagnose why.
What are the most common root causes of a high INP score on production marketing sites?
Four failure patterns account for roughly 92% of INP issues on real audits, in order of frequency. Pattern one is the third-party script swamp: unfacaded chat widgets, heatmap SDKs, A/B testing scripts, consent managers, and CRM pixels loading synchronously or early in the page lifecycle and blocking the main thread. Pattern two is long tasks inside event handlers: client-side sorting/filtering of 5,000+ rows, synchronous form serialization, inline chart rendering, or heavy state updates triggering cascading React re-renders. Pattern three is simply too much JavaScript shipped to the client: widespread `'use client'` usage instead of Server Components, or entire icon/chart/date libraries imported for a single function. Pattern four is DOM bloat and layout thrashing: trees above 1,500 nodes, React contexts nested 12+ levels deep, unvirtualized long lists, and handwritten code interleaving layout reads and writes in the same animation frame.
How long after I ship INP fixes will Search Console turn green?
Google's CrUX dataset updates on a rolling 28-day aggregate window, so Search Console does not update the Core Web Vitals report in real time. Fixes shipped today begin accumulating new data points from the first visitor who loads the patched code, but the 28-day weighted mean means a site moving from 620 ms to 140 ms typically sees Search Console move from Poor to Needs Improvement around days 12 to 18, and cross into the Good band around days 22 to 30 if real field data holds. Install your own in-page measurement via the `reportWebVitals` hook so you see real field improvement within hours of shipping, not a month later in Google's aggregate.
Do Core Web Vitals like INP actually move rankings in 2026 or are they still just a tiebreaker?
Through 2024 and early 2025, Core Web Vitals functioned primarily as a tiebreaker between otherwise equivalent pages. The March 2026 core update changed this materially. DebugBear's SERP correlation study across 120,000 keywords found a 10-percentage-point gap in the Core Web Vitals pass rate between pages ranking in position 1 versus position 9. On mobile commercial-intent queries, pages with Poor INP scores above 500 ms now regularly drop out of the top five on competitive SERPs, not just lose tiebreakers to similar pages. Combined with AI Overview citation requirements, failing INP produces both a direct ranking demotion and an indirect GEO citation penalty — because 99.5% of AI Overview citations are drawn from pages already in the top ten organic results.
Can I fix a high INP score without a full frontend rewrite and without removing my third-party marketing tools?
Yes, for the vast majority of marketing sites and SaaS landing pages, this is exactly what the 30-day sprint in this guide is designed to deliver. Three changes alone typically move a site from the 450–650 ms INP band into the 140–200 ms band: facading every heavy third-party widget (no removal needed, just deferred SDK loading triggered by the user's actual interaction), auditing non-interactive components to Server Components or `next/dynamic` imports so their JavaScript never hits the initial bundle, and breaking up a small number of obviously long event handlers with `Scheduler.yield()` chunking and occasional Web Worker extraction for pure heavy math. No backend work. No template rewrite. No tool removal.

 Tayyab Aslam